Skew surge history: Wales
Other locations:
England – South | England – East | England – West | Wales | Scotland | Northern Ireland | Isle of Man | Channel Islands
The seven tide gauges around the Welsh coast are exposed to three different tidal regimes. The sea level recorded at Llandudno, Holyhead and Barmouth tide gauges are subjected to the tides and weather experienced in the Irish Sea. Fishguard, on the north Pembrokeshire coast, is subject to the tide of the St. George’s Channel. Whereas on the south Wales coast the tide gauges at Milford Haven, Mumbles and Newport all record the sea level which results from the tidal forcing of the Bristol Channel and the weather systems that approach from the Celtic Sea.
The skew surge results are displayed alphabetically by tide gauge location. Click on images to view larger versions.
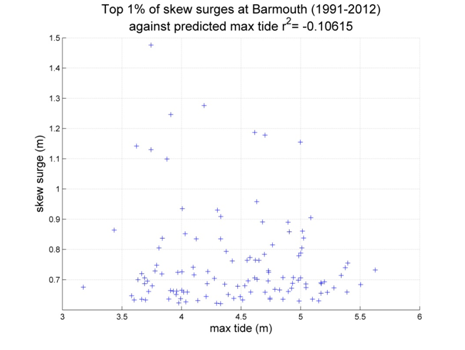
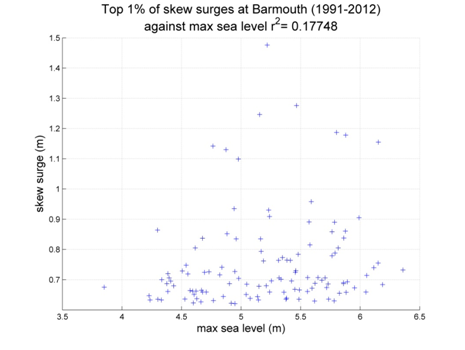
Barmouth
Data from 1991–2012 [data 81% complete]

Top 10 skew surges
- Date
- Surge (m)
- 1997/12/24 18:00
- 1.476
- 1997/02/19 18:30
- 1.276
- 1997/12/25 17:00
- 1.246
- 2007/01/18 07:30
- 1.187
- 2006/12/03 06:30
- 1.178
- 2000/11/25 20:15
- 1.155
- 1996/11/06 04:45
- 1.142
- 1994/12/08 06:00
- 1.119
- 1993/01/17 03:15
- 1.099
- 2010/11/11 11:15
- 0.958
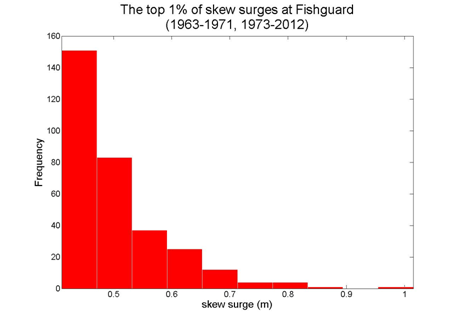
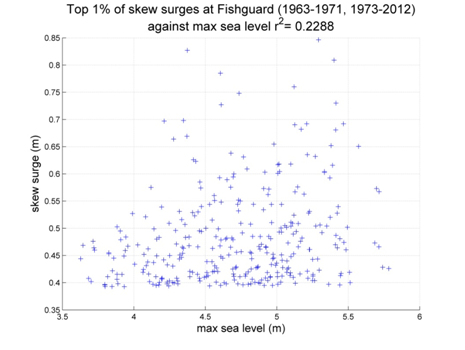
Fishguard
Data from 1963–1971, 1973–2012 [data 94% complete]

Top 10 skew surges
- Date
- Surge (m)
- 1989/12/16 22:00
- 1.015
- 2006/12/03 05:00
- 0.846
- 2002/01/23 13:45
- 0.827
- 1998/01/04 11:15
- 0.809
- 1976/01/02 20:00
- 0.790
- 2000/12/31 22:45
- 0.785
- 1996/01/08 21:00
- 0.760
- 1997/02/19 17:45
- 0.748
- 1994/03/31 22:15
- 0.730
- 1963/11/10 15:00
- 0.727
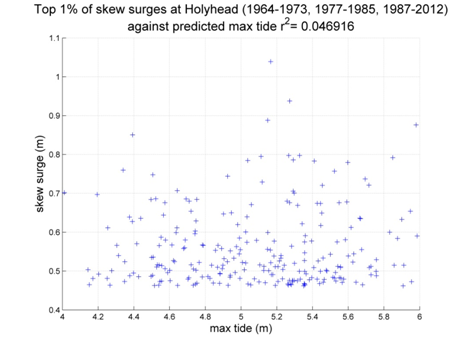
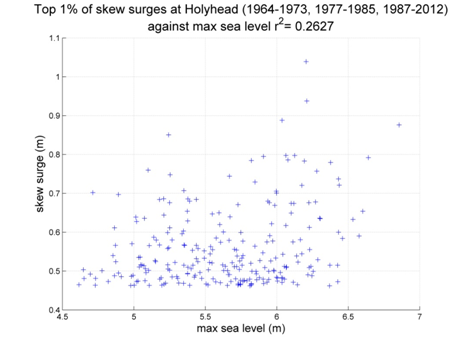
Holyhead
Data from 1964–1973, 1977–1985, 1987–2012 [data 86% complete]

Top 10 skew surges
- Date
- Surge (m)
- 1989/12/17 01:00
- 1.039
- 1984/01/02 22:00
- 0.938
- 1988/02/01 10:00
- 0.888
- 2002/02/01 12:45
- 0.876
- 2007/01/13 17:00
- 0.851
- 1987/03/27 09:00
- 0.797
- 2006/11/19 21:30
- 0.797
- 1990/01/25 10:00
- 0.795
- 2000/12/12 23:30
- 0.792
- 2011/02/03 23:00
- 0.786
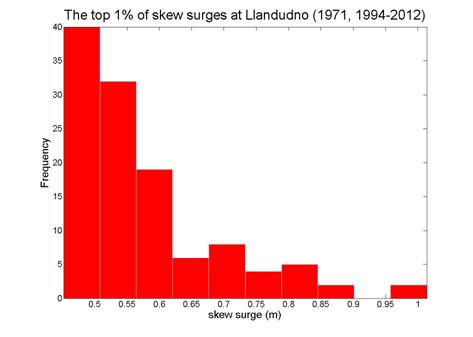
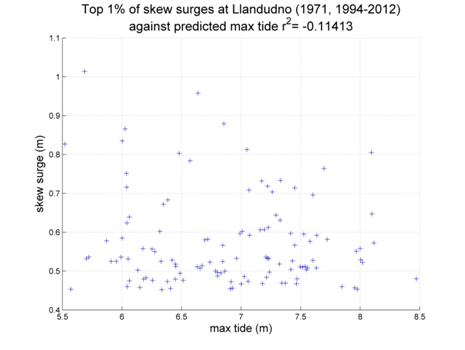
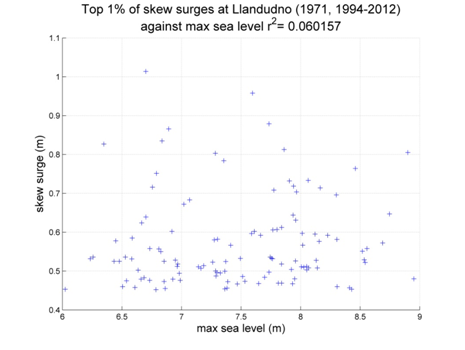
Llandudno
Data from 1971, 1994–2012 [data 87% complete]
Top 10 skew surges
- Date
- Surge (m)
- 2007/01/13 18:00
- 1.014
- 1997/02/19 21:00
- 0.958
- 2005/01/08 08:15
- 0.879
- 1997/12/24 19:30
- 0.866
- 1996/11/06 07:00
- 0.835
- 2008/02/29 16:00
- 0.827
- 2006/11/19 22:00
- 0.813
- 2002/02/01 13:15
- 0.805
- 1999/12/03 08:00
- 0.803
- 2011/12/01 02:30
- 0.784
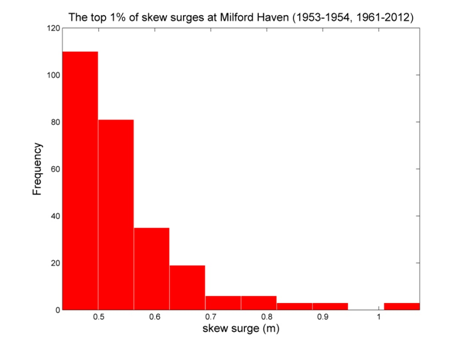
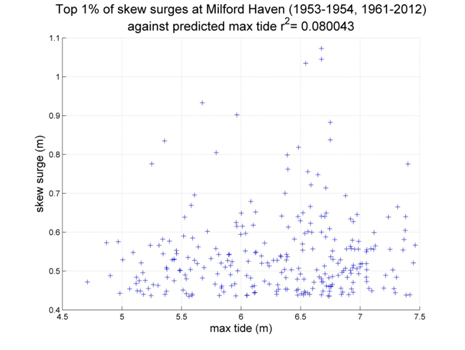
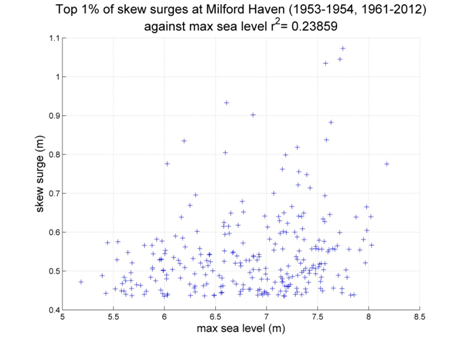
Milford Haven
Data from 1953–1954, 1961–2012 [data 81% complete]
Top 10 skew surges
- Date
- Surge (m)
- 1989/12/16 21:00
- 1.202
- 1998/01/04 09:45
- 1.073
- 1969/01/17 18:00
- 1.039
- 2006/12/03 03:45
- 1.035
- 1974/01/27 21:00
- 0.991
- 1974/01/16 12:00
- 0.933
- 1997/02/19 16:45
- 0.902
- 1977/03/15 15:00
- 0.864
- 1989/12/21 00:00
- 0.855
- 1962/01/17 04:00
- 0.841
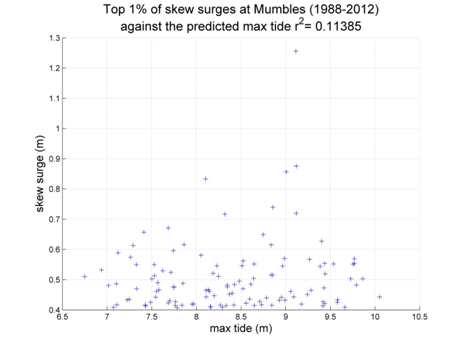
Mumbles
Data from 1988–2012 [data 77% complete]
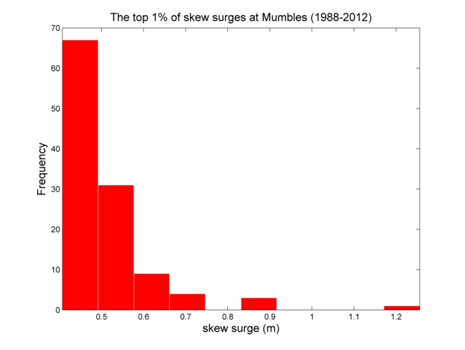

Top 10 skew surges
- Date
- Surge (m)
- 1998/01/04 10:15
- 1.256
- 1989/12/16 21:00
- 1.062
- 1989/12/16 09:00
- 0.876
- 2006/12/03 04:00
- 0.857
- 2000/12/08 03:30
- 0.833
- 1989/12/21 00:00
- 0.775
- 1991/01/01 19:00
- 0.742
- 1989/12/17 09:00
- 0.739
- 2005/01/08 03:45
- 0.717
- 1989/04/11 10:00
- 0.691
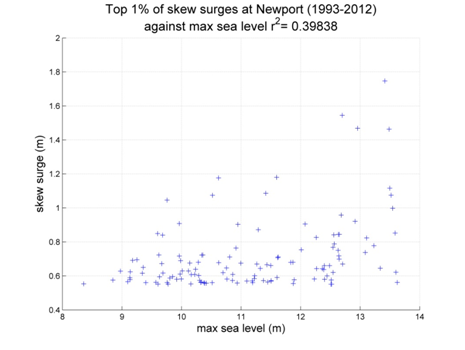
Newport
Data from 1993–2012 [data 90% complete]
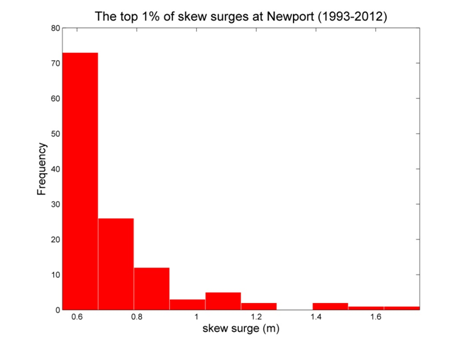

Top 10 skew surges
- Date
- Surge (m)
- 1997/02/24 20:45
- 1.747
- 2006/12/03 05:15
- 1.545
- 1998/01/04 11:15
- 1.468
- 1995/02/16 19:45
- 1.463
- 2005/01/08 04:45
- 1.180
- 2004/10/20 23:30
- 1.176
- 1999/01/03 07:45
- 1.116
- 1997/02/19 18:00
- 1.086
- 1996/10/28 20:15
- 1.075
- 1997/12/25 15:30
- 1.074