Skew surge history: England – South
Other locations:
England – South | England – East | England – West | Wales | Scotland | Northern Ireland | Isle of Man | Channel Islands
Tide gauges in the south of England stretch from Dover in the east past St. Mary’s in the Isles of Scilly to Avonmouth located in the Bristol Channel. The gauges on the south coast are exposed to the tidal forcing and the weather systems of the English Channel while the gauges at Ilfracombe, Hinkley Point and Avonmouth are exposed to the greater tidal range and the weather systems of the Bristol Channel.
The skew surge results are displayed alphabetically by tide gauge location. Click on images to view larger versions.
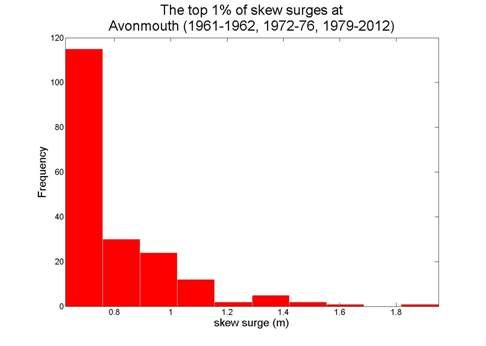
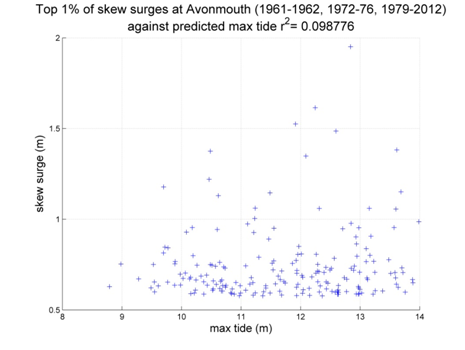
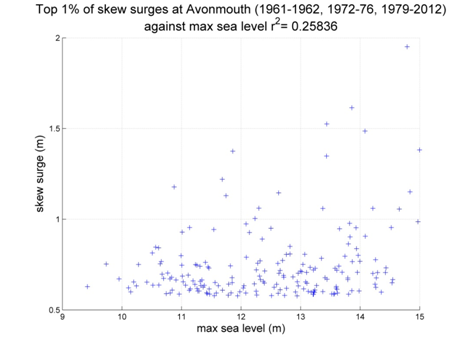
Avonmouth
Data from 1961–1962, 1972–1976, 1979–2012 [data 79% complete]
Top 10 skew surges
- Date
- Surge (m)
- 1997/02/24 20:45
- 1.951
- 2006/12/03 05:15
- 1.615
- 1988/01/06 08:00
- 1.525
- 1998/01/04 11:15
- 1.486
- 1961/09/16 11:00
- 1.386
- 1990/02/26 08:00
- 1.382
- 2004/10/20 23:30
- 1.375
- 2007/01/18 06:15
- 1.348
- 1990/02/07 05:00
- 1.338
- 1997/12/25 15:45
- 1.220
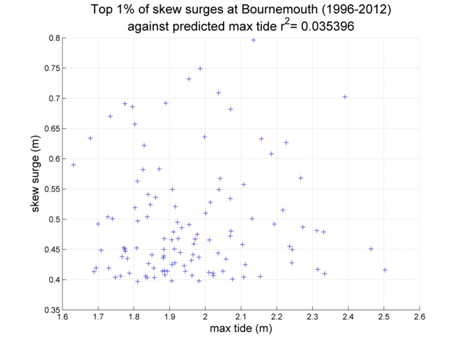
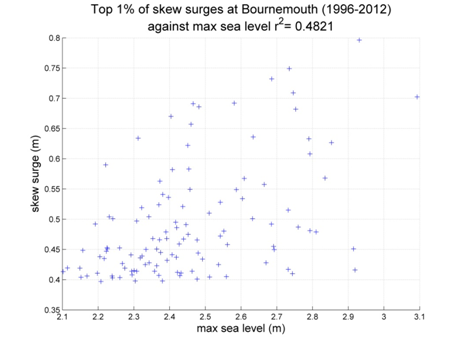
Bournemouth
Data from 1996–2012 [data 96% complete]

Top 10 skew surges
- Date
- Surge (m)
- 2006/12/03 06:15
- 0.796
- 2007/03/06 02:00
- 0.752
- 2001/01/02 05:00
- 0.749
- 2009/01/19 06:30
- 0.732
- 1998/01/04 14:00
- 0.709
- 2008/03/10 10:30
- 0.702
- 1998/01/05 14:00
- 0.692
- 2007/02/12 07:00
- 0.691
- 2009/01/23 07:30
- 0.686
- 2002/11/14 08:15
- 0.682
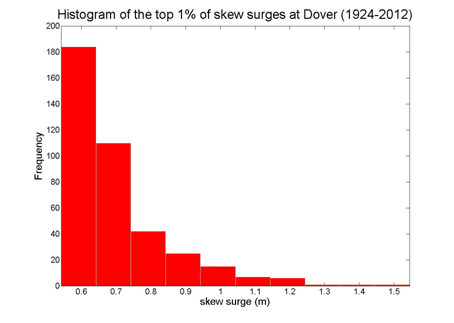
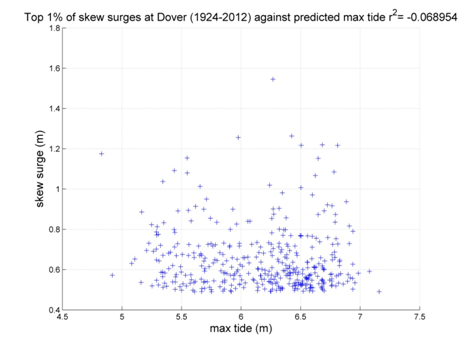
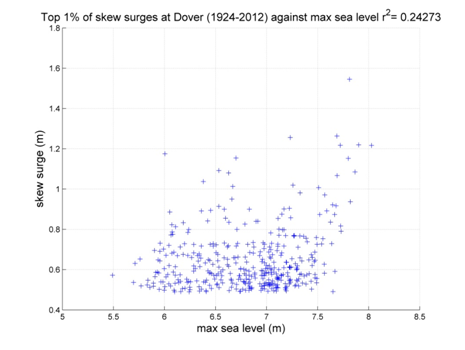
Dover
Data from 1924–2012 [data 90% complete]
Top 10 skew surges
- Date
- Surge (m)
- 1993/02/21 11:00
- 1.545
- 1962/02/16 22:00
- 1.359
- 2007/11/09 10:30
- 1.263
- 1961/03/21 02:00
- 1.219
- 1926/10/10 12:00
- 1.217
- 1983/02/02 02:00
- 1.217
- 2008/03/01 17:00
- 1.175
- 2012/01/05 20:45
- 1.154
- 1976/01/04 00:00
- 1.152
- 2000/01/30 05:45
- 1.092
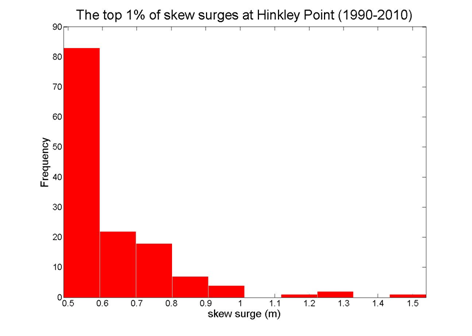
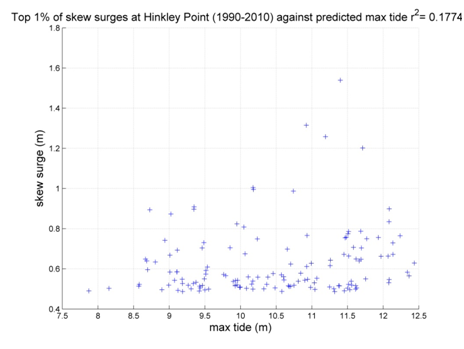
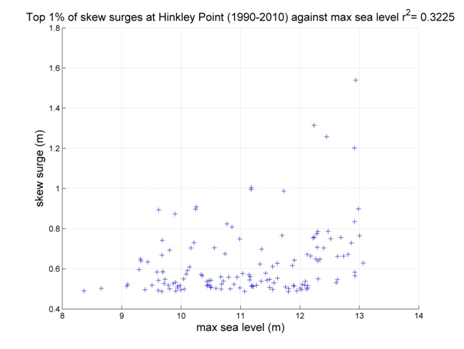
Hinkley Point
Data from 1990–2012 [data 95% complete]
Top 10 skew surges
- Date
- Surge (m)
- 1997/02/24 20:15
- 1.539
- 2006/12/03 04:45
- 1.315
- 1998/01/04 10:45
- 1.258
- 1995/02/16 19:30
- 1.202
- 1997/02/19 17:45
- 1.005
- 2005/01/08 04:15
- 0.995
- 2007/01/18 05:45
- 0.987
- 1997/12/25 15:00
- 0.909
- 1996/10/28 19:45
- 0.899
- 2004/10/20 23:00
- 0.897
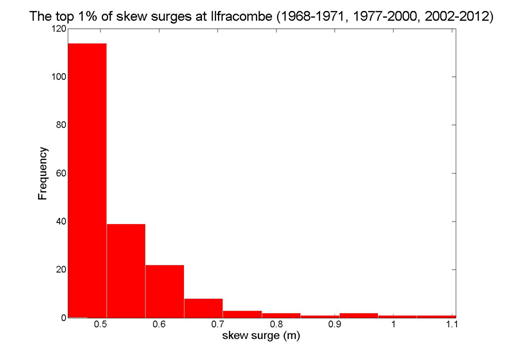
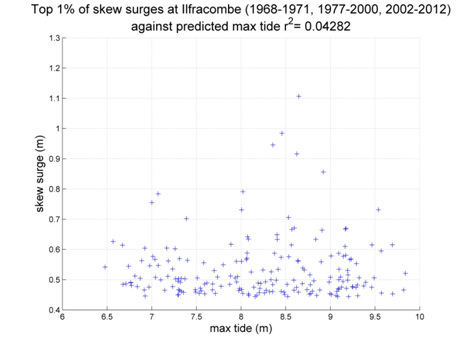
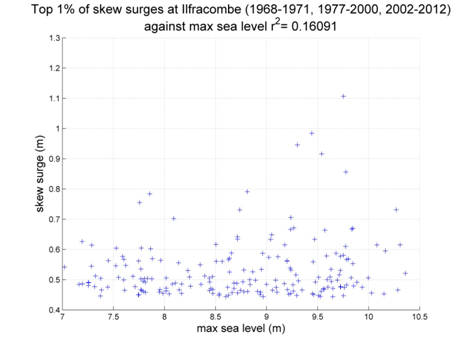
Ilfracombe
Data from 1968–1971, 1977–2000, 2002–2012 [data 78% complete]
Top 10 skew surges
- Date
- Surge (m)
- 1969/01/17 17:00
- 1.107
- 1989/12/16 21:00
- 0.984
- 1986/03/24 05:00
- 0.946
- 2006/12/03 03:45
- 0.916
- 1989/12/16 08:00
- 0.856
- 1988/02/01 05:00
- 0.791
- 1995/02/11 15:45
- 0.784
- 1989/12/21 00:00
- 0.755
- 1984/11/23 18:00
- 0.732
- 2005/01/08 03:30
- 0.731
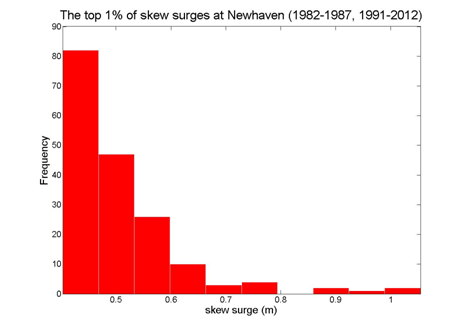
Newhaven
Data from 1982–1987, 1991–2012 [data 93% complete]


Top 10 skew surges
- Date
- Surge (m)
- 1987/10/16 05:00
- 1.054
- 1993/02/21 11:15
- 0.991
- 2002/11/14 06:45
- 0.930
- 2008/03/01 16:45
- 0.874
- 1983/02/02 02:00
- 0.862
- 1984/01/14 07:00
- 0.780
- 2004/12/17 15:30
- 0.768
- 1998/01/04 15:00
- 0.750
- 2009/01/23 09:15
- 0.741
- 2003/01/02 10:15
- 0.705
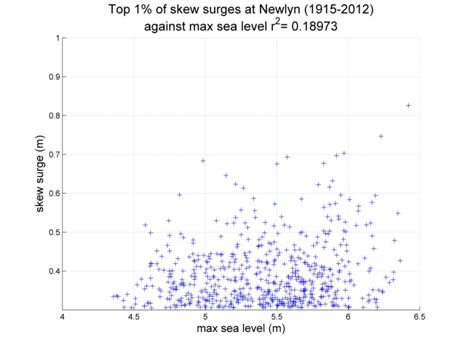
Newlyn
Data from 1915–2012 [data 87% complete]


Top 10 skew surges
- Date
- Surge (m)
- 1989/12/16 19:00
- 0.930
- 2004/10/27 16:15
- 0.826
- 1936/01/05 14:00
- 0.766
- 1989/12/16 07:00
- 0.747
- 1983/12/18 15:00
- 0.721
- 1926/02/01 07:00
- 0.703
- 2006/12/03 02:45
- 0.697
- 1996/01/11 20:00
- 0.693
- 1954/11/26 17:00
- 0.689
- 2002/01/23 11:15
- 0.684
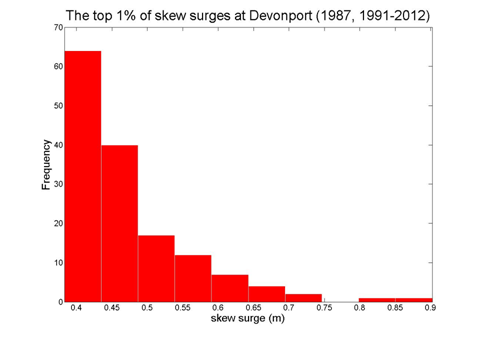
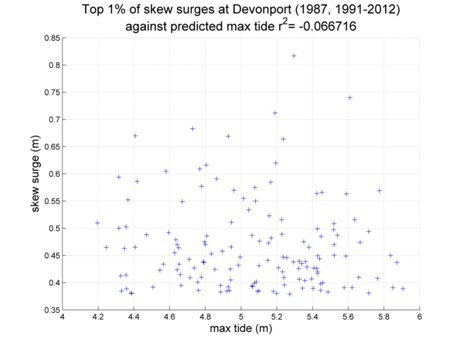
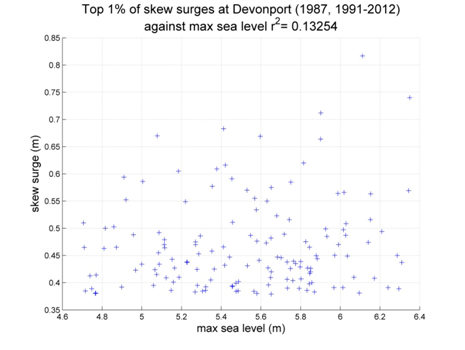
Plymouth (Devonport)
Data from 1987, 1991–2012 [data 90% complete]
Top 10 skew surges
- Date
- Surge (m)
- 1987/10/16 00:00
- 0.902
- 2006/12/03 04:00
- 0.817
- 2004/10/27 17:15
- 0.740
- 1996/01/06 18:15
- 0.712
- 2000/12/31 21:00
- 0.683
- 2002/01/23 12:30
- 0.670
- 1996/01/11 21:00
- 0.669
- 1996/01/11 08:45
- 0.664
- 1996/01/08 19:30
- 0.620
- 1987/10/18 03:00
- 0.617
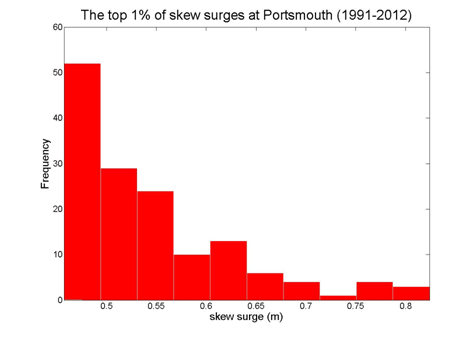
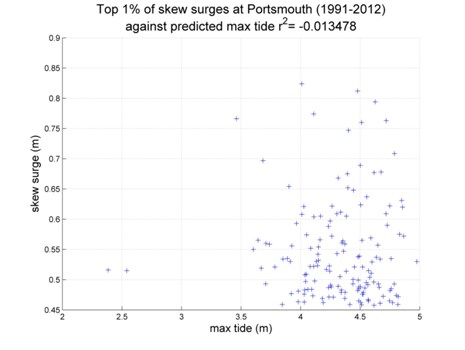
Portsmouth
Data from 1991–2012 [data 94% complete]

Top 10 skew surges
- Date
- Surge (m)
- 2002/11/14 08:00
- 0.824
- 1998/01/04 15:00
- 0.812
- 1995/01/19 13:00
- 0.794
- 2001/01/02 03:30
- 0.774
- 2008/03/01 18:00
- 0.766
- 1994/12/07 02:00
- 0.763
- 2007/03/06 00:30
- 0.760
- 1993/02/21 11:30
- 0.747
- 2008/03/10 13:00
- 0.709
- 2002/02/22 19:00
- 0.697
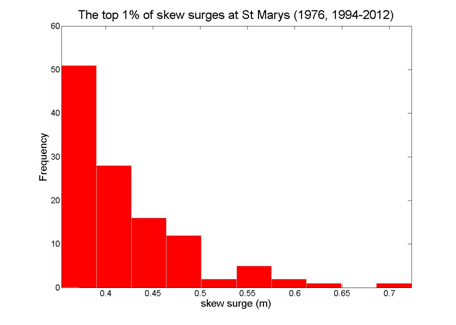
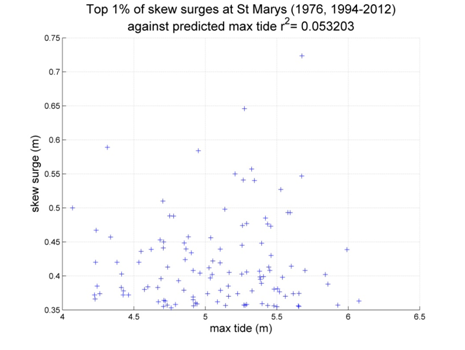
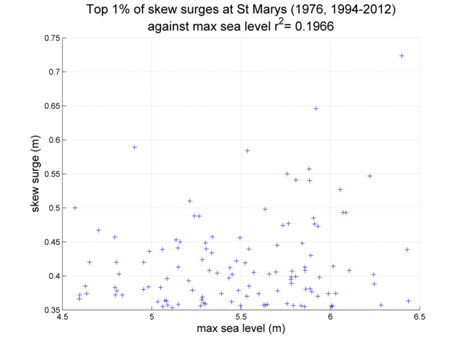
St. Mary’s
Data from 1976, 1994–2012 [data 87% complete]
Top 10 skew surges
- Date
- Surge (m)
- 2004/10/27 16:15
- 0.723
- 1996/01/06 17:30
- 0.646
- 2002/01/23 11:15
- 0.589
- 1996/01/11 20:00
- 0.584
- 2006/12/03 02:30
- 0.557
- 1996/01/11 07:45
- 0.550
- 2004/10/28 16:45
- 0.547
- 1996/01/08 18:15
- 0.541
- 2006/09/21 16:15
- 0.540
- 2003/01/02 03:45
- 0.527
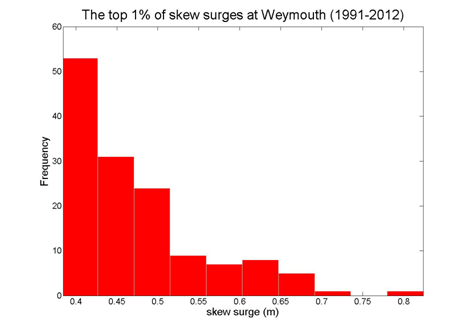
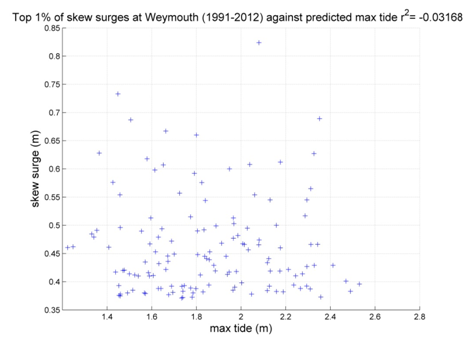
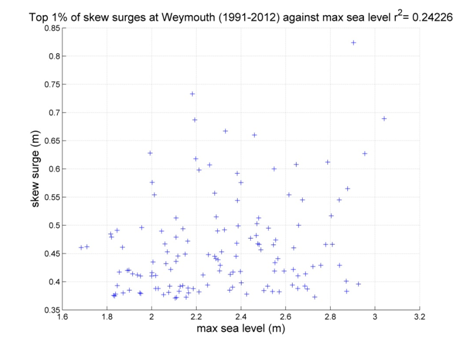
Weymouth
Data from 1991-2012 [data 94% complete]
Top 10 skew surges
- Date
- Surge (m)
- 2006/12/03 05:45
- 0.824
- 2002/11/14 03:15
- 0.733
- 2008/03/10 09:00
- 0.689
- 2002/10/15 12:45
- 0.687
- 2007/02/12 08:00
- 0.675
- 2000/12/31 21:30
- 0.667
- 2000/12/08 02:45
- 0.660
- 2007/02/12 06:45
- 0.635
- 2004/01/31 12:45
- 0.628
- 2004/10/27 18:00
- 0.627