Skew surge history: Scotland
Other locations:
England – South | England – East | England – West | Wales | Scotland | Northern Ireland | Isle of Man | Channel Islands
Scotland has twelve tide gauges covering its coastline. From Portpatrick on the west coast to the Outer Hebrides and Shetland Islands in the north, they continue to the industrial city of Aberdeen on the east coast and then on to Leith on the southern edge of the Firth of Forth. The western coast of Scotland is exposed to the tides and pressure systems of the North Atlantic while the gauges on the east coast record the level of the North Sea.
The skew surge results are displayed alphabetically by tide gauge location. Click on images to view larger versions.
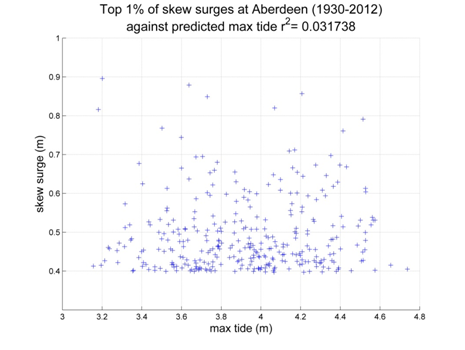
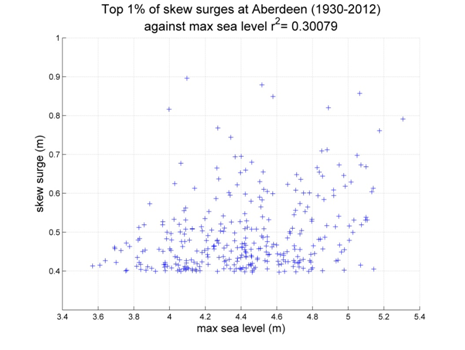
Aberdeen
Data from 1930–2012 [data 80% complete]
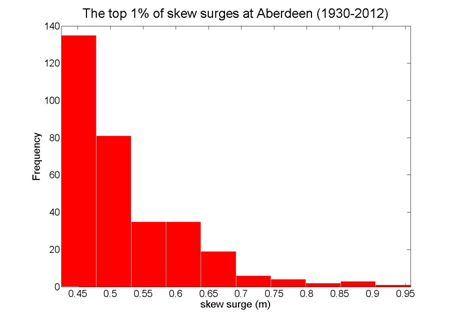
Top 10 skew surges
- Date
- Surge (m)
- 1990/02/19 21:00
- 0.958
- 1993/01/16 07:15
- 0.879
- 1992/01/01 11:00
- 0.866
- 2002/02/02 04:15
- 0.857
- 2008/10/25 23:00
- 0.820
- 2008/03/01 06:45
- 0.816
- 1967/02/28 04:00
- 0.791
- 2005/01/12 14:30
- 0.791
- 2000/01/29 19:45
- 0.768
- 1993/01/11 02:45
- 0.761
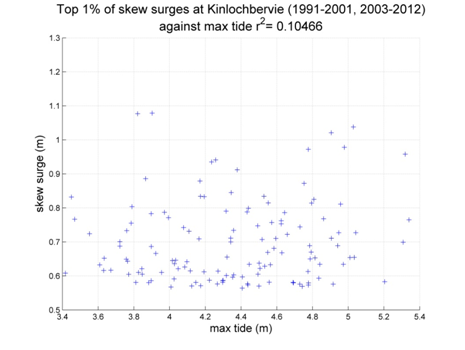
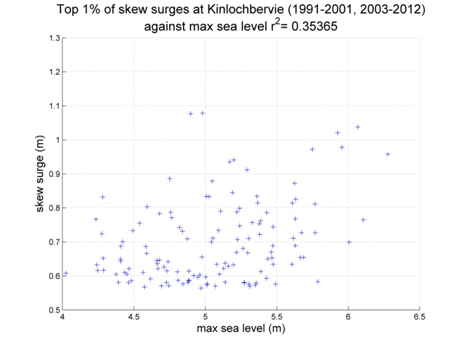
Kinlochbervie
Data from 1991–2001, 2003–2012 [data 89% complete]
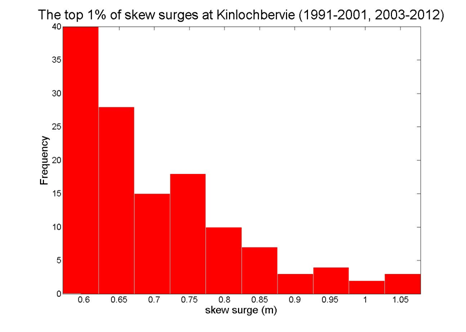
Top 10 skew surges
- Date
- Surge (m)
- 2007/01/11 12:30
- 1.079
- 1997/03/02 12:15
- 1.077
- 1993/01/10 21:00
- 1.038
- 1995/01/18 08:15
- 1.021
- 2005/01/11 20:15
- 0.978
- 2007/03/05 08:00
- 0.972
- 2005/01/12 08:30
- 0.958
- 1999/01/15 18:30
- 0.941
- 2000/01/03 05:30
- 0.935
- 1993/01/15 12:45
- 0.912
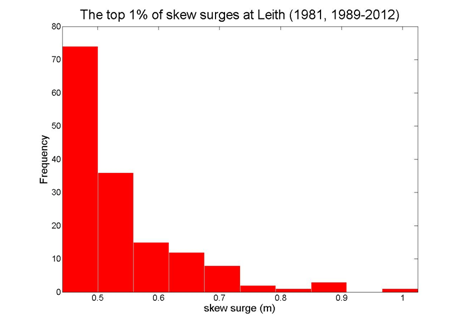
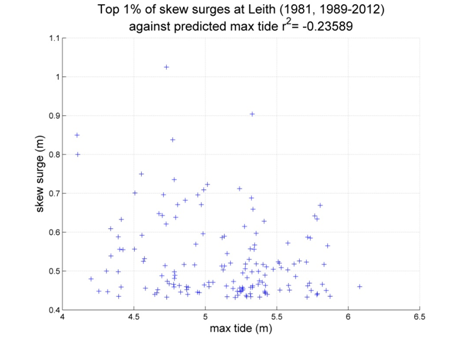
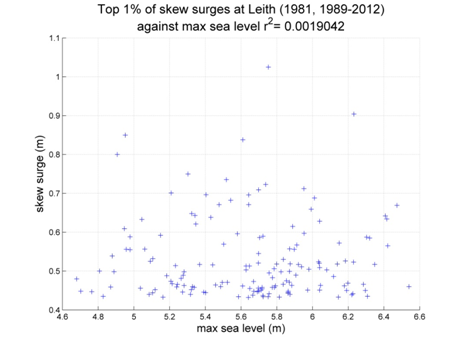
Leith
Data from 1981, 1989–2012 [data 87% complete]
Top 10 skew surges
- Date
- Surge (m)
- 1993/01/16 08:15
- 1.025
- 1997/02/25 16:15
- 0.904
- 1992/01/01 12:00
- 0.894
- 1990/02/19 22:00
- 0.880
- 2008/03/01 08:00
- 0.850
- 2007/01/11 19:45
- 0.750
- 2006/01/11 12:15
- 0.735
- 2011/12/09 01:30
- 0.723
- 2008/10/26 00:30
- 0.712
- 1993/12/19 18:30
- 0.709
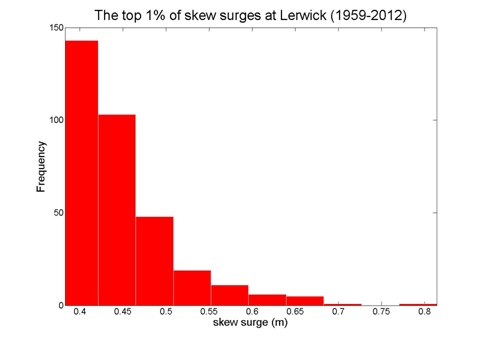
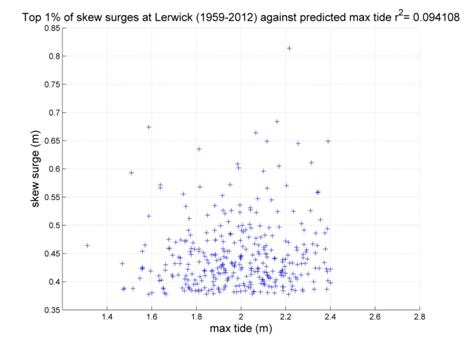
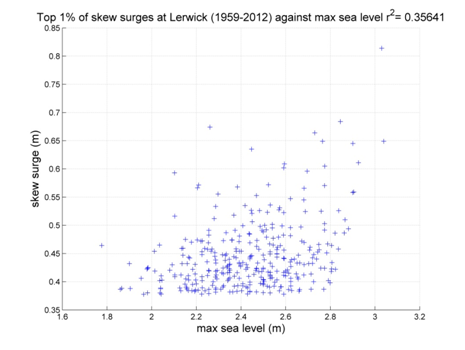
Lerwick
Data from 1959–2012 [data 83% complete]
Top 10 skew surges
- Date
- Surge (m)
- 1993/01/11 00:15
- 0.814
- 1993/01/12 01:30
- 0.684
- 1990/02/20 07:00
- 0.674
- 2002/02/02 02:15
- 0.664
- 1990/02/27 00:00
- 0.649
- 1993/01/11 12:30
- 0.649
- 2002/02/02 13:45
- 0.645
- 1993/01/17 18:30
- 0.635
- 1990/02/27 12:00
- 0.611
- 1997/02/25 01:00
- 0.609
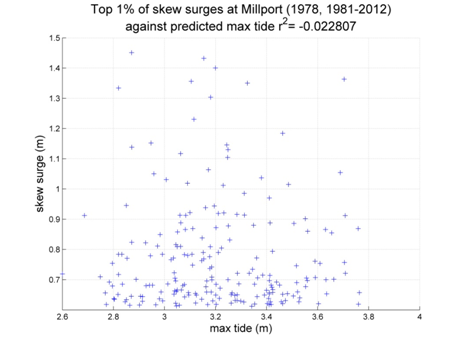
Millport
Data from 1978, 1981–2012 [data 90% complete]
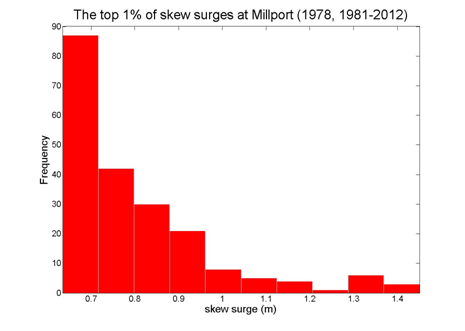

Top 10 skew surges
- Date
- Surge (m)
- 2012/01/03 08:15
- 1.451
- 1995/01/18 01:15
- 1.432
- 1988/02/01 11:00
- 1.400
- 1991/01/05 15:00
- 1.363
- 1993/01/24 01:30
- 1.356
- 1988/02/09 16:00
- 1.350
- 1996/11/06 07:15
- 1.334
- 2006/12/31 20:15
- 1.303
- 1982/03/03 05:00
- 1.288
- 2008/01/09 00:30
- 1.231
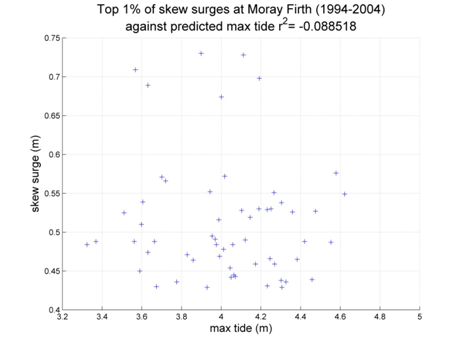
Moray Firth
Data from 1994–2004 [data 75% complete]


Top 10 skew surges
- Date
- Surge (m)
- 1999/01/15 23:00
- 0.730
- 1997/02/25 01:45
- 0.728
- 2000/01/29 19:15
- 0.709
- 1994/04/01 03:00
- 0.698
- 1997/02/18 09:15
- 0.689
- 2001/10/08 02:30
- 0.674
- 1996/02/18 11:45
- 0.576
- 1997/02/20 10:15
- 0.572
- 1996/11/06 21:00
- 0.571
- 2003/01/15 22:15
- 0.566
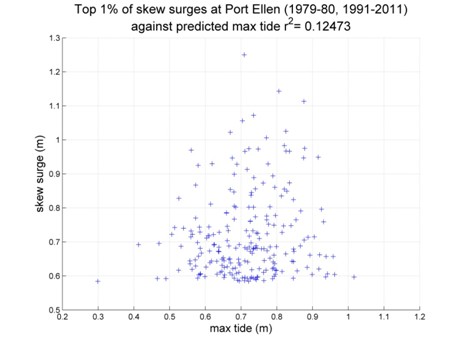
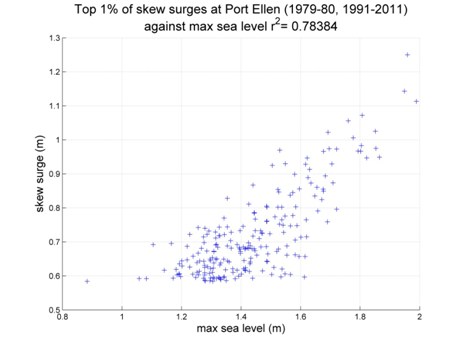
Port Ellen
Data from 1979–1980, 1991–2012 [data 93% complete]
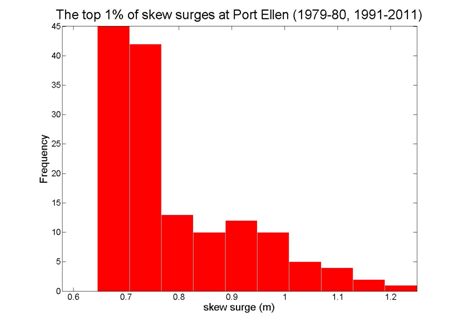
Top 10 skew surges
- Date
- Surge (m)
- 1998/12/26 20:00
- 1.250
- 1995/01/18 03:00
- 1.164
- 2005/01/11 18:45
- 1.149
- 1993/01/17 05:45
- 1.120
- 2010/11/11 16:45
- 1.113
- 2006/12/03 07:15
- 1.086
- 1996/11/06 05:30
- 1.085
- 2007/01/11 08:15
- 1.056
- 2002/03/10 16:15
- 1.036
- 2005/11/11 13:45
- 1.025
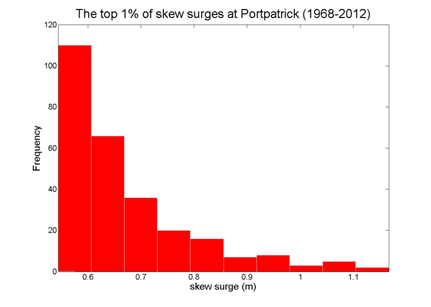
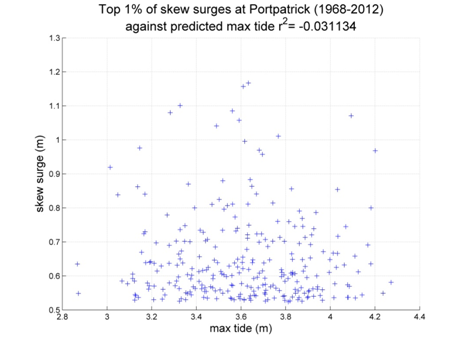
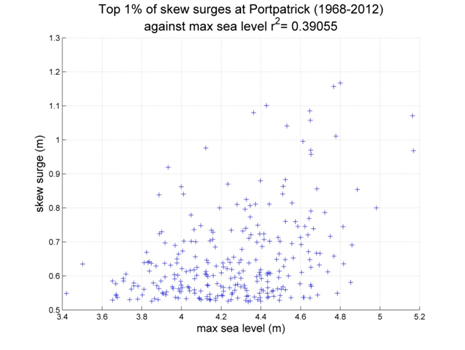
Portpatrick
Data from 1968–2012 [data 87% complete]
Top 10 skew surges
- Date
- Surge (m)
- 1988/02/01 11:00
- 1.167
- 1995/01/18 00:00
- 1.157
- 1993/01/17 06:15
- 1.101
- 1993/01/24 00:45
- 1.085
- 1997/12/24 19:30
- 1.080
- 1991/01/05 15:00
- 1.071
- 1988/02/09 15:00
- 1.058
- 2007/03/06 01:00
- 1.041
- 2006/12/03 09:30
- 1.011
- 2006/12/31 20:45
- 0.995
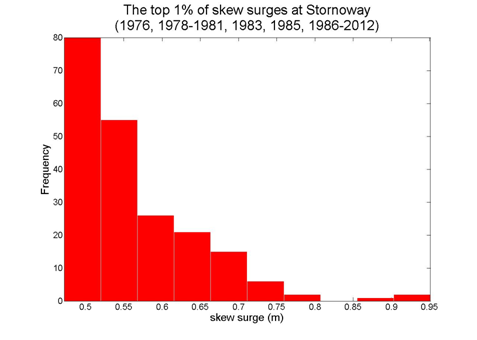
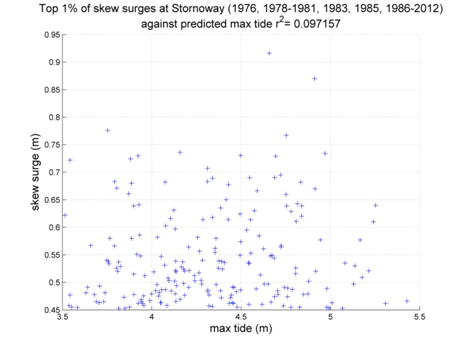
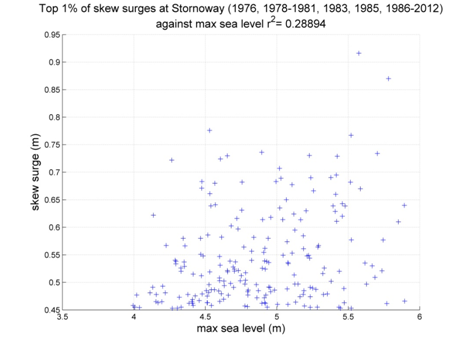
Stornoway
Data from 1976, 1978–1981, 1983, 1985, 1986–2012 [data 86% complete]
Top 10 skew surges
- Date
- Surge (m)
- 1990/02/19 15:00
- 0.951
- 2002/02/01 21:45
- 0.916
- 1993/01/10 20:15
- 0.870
- 1997/03/02 12:15
- 0.776
- 2002/01/28 06:30
- 0.767
- 1989/12/25 05:00
- 0.736
- 2002/02/02 09:45
- 0.734
- 2006/11/20 18:45
- 0.730
- 2007/01/11 12:15
- 0.730
- 1994/03/31 09:45
- 0.729
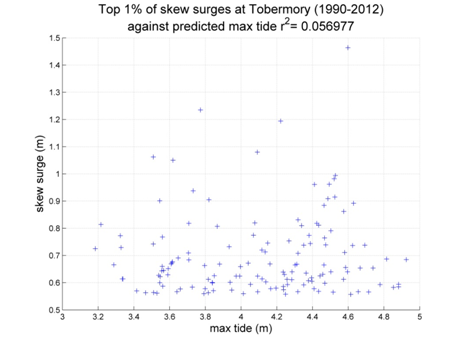
Tobermory
Data from 1990–2012 [data 83% complete]
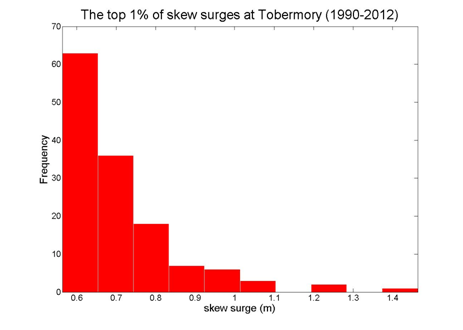

Top 10 skew surges
- Date
- Surge (m)
- 2005/01/11 19:00
- 1.464
- 2009/01/17 21:45
- 1.235
- 1998/11/09 09:15
- 1.194
- 2005/11/11 14:30
- 1.080
- 1996/11/06 03:15
- 1.062
- 2002/03/10 17:15
- 1.050
- 1998/01/03 08:30
- 0.994
- 1995/01/18 06:45
- 0.982
- 1990/02/19 13:00
- 0.965
- 1994/03/31 08:15
- 0.962
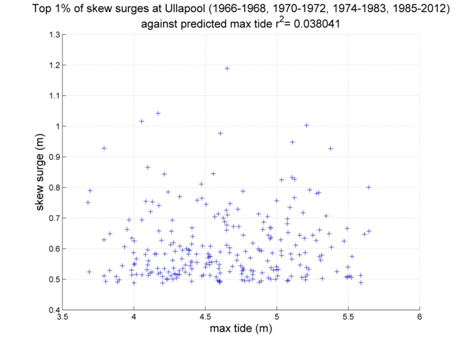
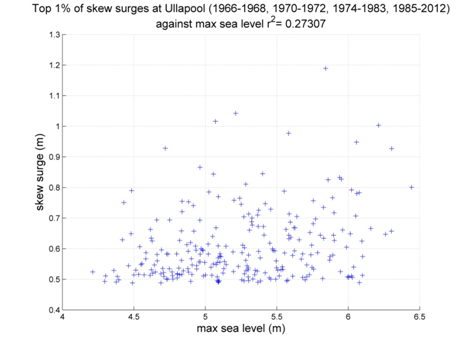
Ullapool
Data from 1966–1968, 1970–1972, 1974–1983, 1985–2012 [data 88% complete]

Top 10 skew surges
- Date
- Surge (m)
- 2011/12/08 17:30
- 1.189
- 1990/02/19 15:00
- 1.146
- 2007/01/11 12:00
- 1.042
- 1997/03/02 12:15
- 1.016
- 1995/01/18 07:30
- 1.003
- 1993/01/15 12:15
- 0.977
- 2002/02/01 21:45
- 0.948
- 1993/01/10 20:45
- 0.927
- 2009/11/25 13:00
- 0.866
- 1999/01/15 17:45
- 0.845
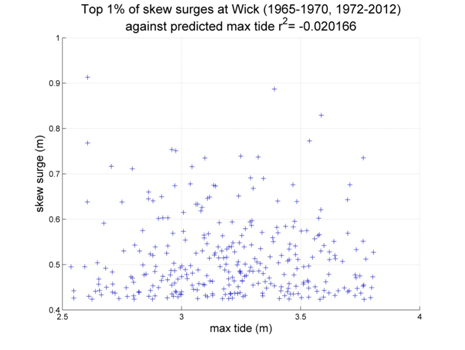
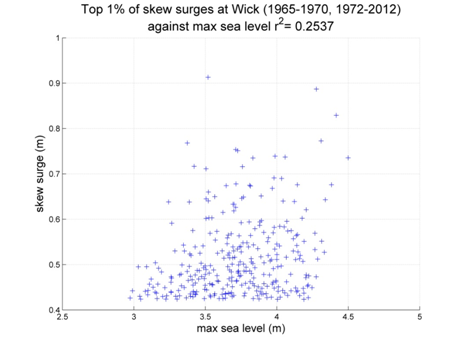
Wick
Data from 1965–1970, 1972–2012 [data 93% complete]

Top 10 skew surges
- Date
- Surge (m)
- 1990/02/19 19:00
- 1.013
- 2002/02/02 02:15
- 0.887
- 1993/01/11 00:45
- 0.829
- 1967/10/26 04:00
- 0.789
- 2006/12/03 21:45
- 0.773
- 1990/02/20 06:00
- 0.768
- 2007/01/11 16:00
- 0.754
- 1993/01/17 18:30
- 0.751
- 1967/02/28 02:00
- 0.745
- 1997/02/25 01:00
- 0.739