Skew surge history: Northern Ireland
Other locations:
England – South | England – East | England – West | Wales | Scotland | Northern Ireland | Isle of Man | Channel Islands
Two tide gauges monitor the sea level on the coast of Northern Ireland, Bangor on the east coast and Portrush on the north coast.
Click on images to view larger versions.
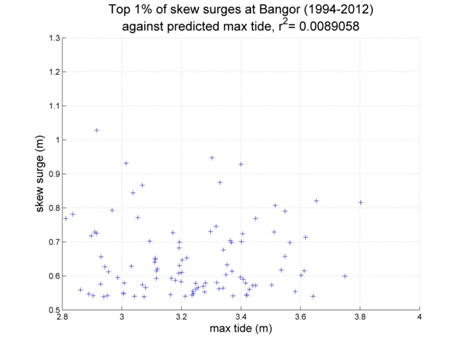
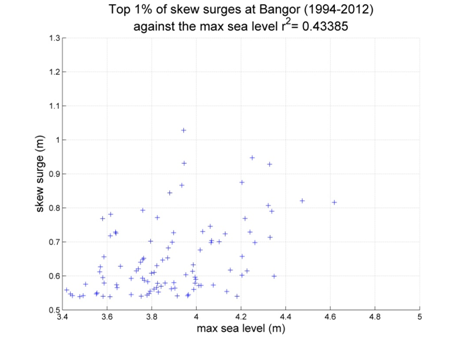
Bangor
Data from 1994–2012 [data 83% complete]
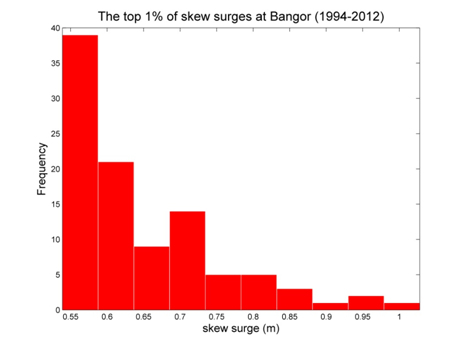
Top 10 skew surges
- Date
- Surge (m)
- 1996/11/06 07:30
- 1.028
- 2006/12/31 20:15
- 0.947
- 1997/02/19 21:45
- 0.931
- 2006/12/03 09:00
- 0.928
- 2006/11/19 22:00
- 0.875
- 2007/03/06 00:30
- 0.866
- 1997/12/24 19:15
- 0.844
- 1998/01/03 14:15
- 0.821
- 2002/02/01 13:30
- 0.816
- 2010/11/11 14:30
- 0.807
Portrush
Data from 1995–2012 [data 94% complete]
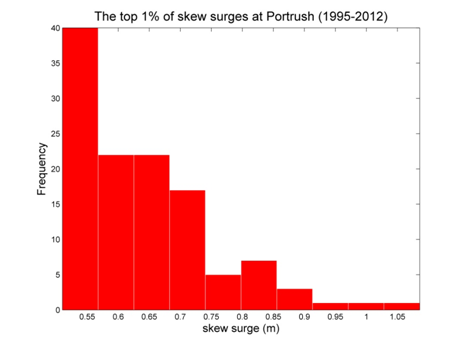
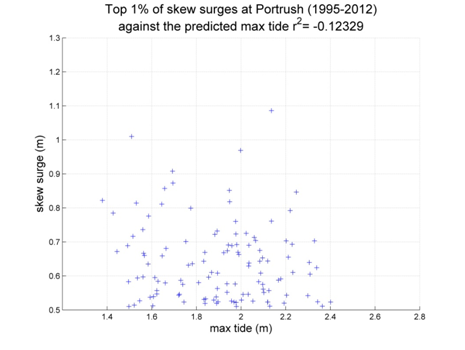
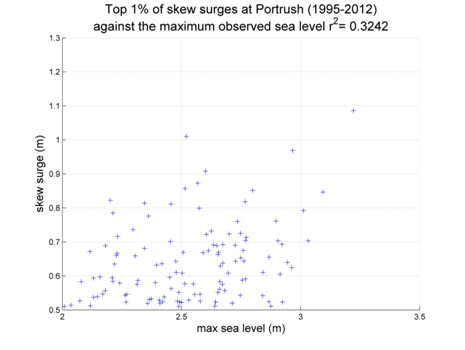
Top 10 skew surges
- Date
- Surge (m)
- 2005/01/11 19:15
- 1.086
- 2009/01/17 22:00
- 1.010
- 1998/11/09 09:45
- 0.969
- 2012/01/03 07:15
- 0.914
- 1996/11/06 05:15
- 0.908
- 2007/01/11 11:45
- 0.873
- 2002/03/10 17:30
- 0.857
- 2006/12/03 06:00
- 0.851
- 2006/12/03 17:15
- 0.846
- 2011/05/23 12:45
- 0.822