Surge model archive for Liverpool – December 2019
Surge model yearly archives from October 2004 are available as zipped ![]() PDF files:
PDF files:
2004 | 2005 | 2006 | 2007 | 2008 | 2009 | 2010 | 2011 | 2012 | 2013 | 2014 | 2015 | 2016 | 2017 | 2018 | 2019
The latest data are usually made available within 6–8 weeks of the end of the month.
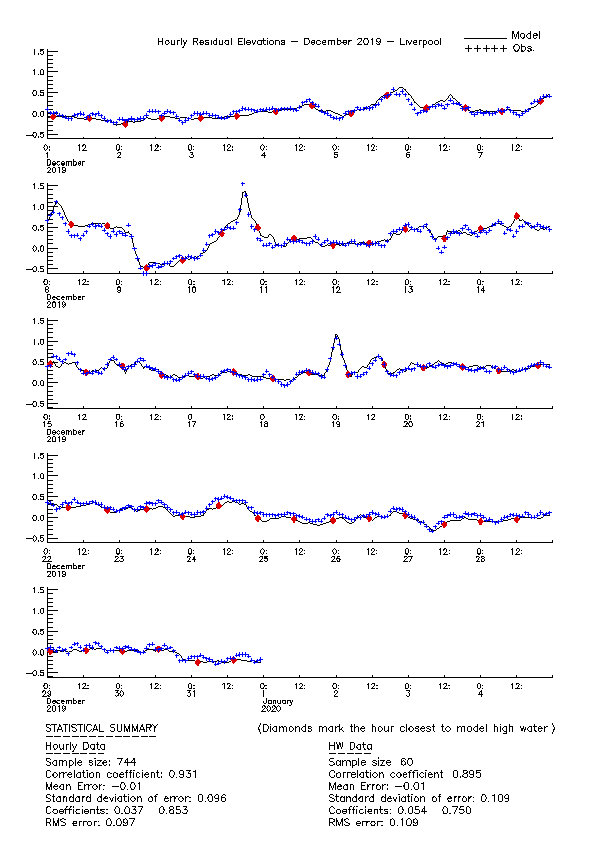
Hourly residual values
Key: line – model, cross – observations, red diamond marks hour closest to model high water
Click here to download the
Hourly residual values
Key: line – model, cross – observations, red diamond marks hour closest to model high water
Flood warnings from the