Skew surge history: England – West
Other locations:
England – South | England – East | England – West | Wales | Scotland | Northern Ireland | Isle of Man | Channel Islands
The three tide gauges on the Irish Sea coast of England record the sea level; tides and weather systems that cross the Irish Sea dictate the sea level in this region.
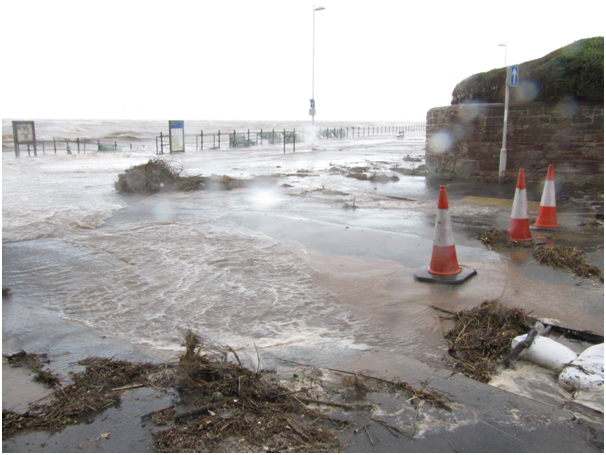
On 5 December 2013 a large storm event across the UK created a surge. This surge peak at the Liverpool tide gauge had an amplitude of 1.25 m. The combination of strong northwesterly winds and high spring tides caused flooding in exposed coastal communites like Hoylake (pictured left).
The skew surge results are displayed alphabetically by tide gauge location. Click on images to view larger versions.
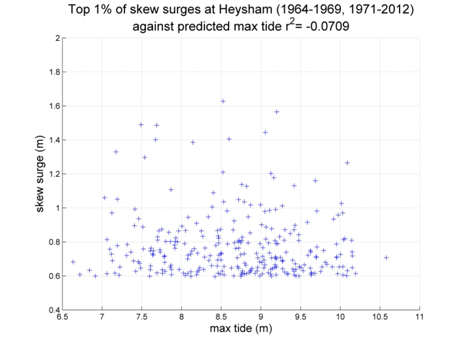
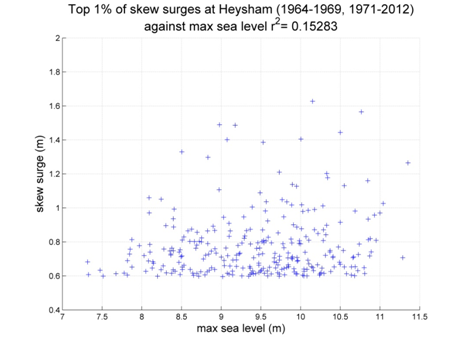
Heysham
Data from 1964–1969, 1971–2012 [data 82% complete]

Top 10 skew surges
- Date
- Surge (m)
- 1988/02/09 15:00
- 1.627
- 1984/01/13 07:00
- 1.576
- 2004/03/19 10:15
- 1.565
- 1996/11/06 07:45
- 1.489
- 2004/10/21 04:15
- 1.486
- 1993/01/24 00:00
- 1.444
- 1984/01/02 23:00
- 1.408
- 2005/01/08 08:45
- 1.405
- 2007/01/11 04:00
- 1.402
- 1999/12/03 08:15
- 1.386
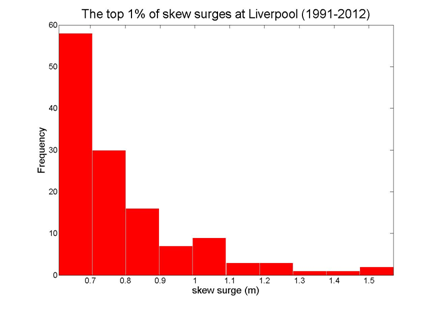
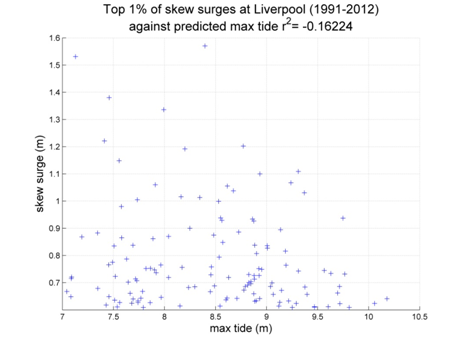
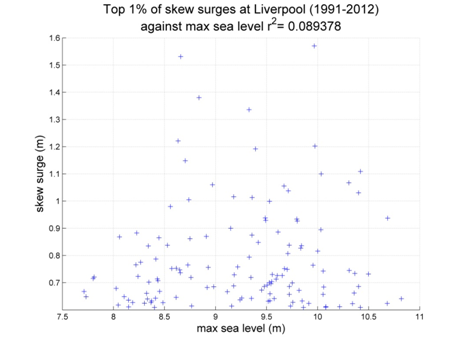
Liverpool
Data from 1991–2012 [data 87% complete]
Top 10 skew surges
- Date
- Surge (m)
- 2005/01/08 08:30
- 1.570
- 2007/01/13 18:30
- 1.531
- 1997/12/24 20:00
- 1.380
- 1999/12/03 08:45
- 1.336
- 1996/11/06 07:30
- 1.221
- 1993/01/24 00:00
- 1.202
- 1997/02/19 21:45
- 1.192
- 2007/01/11 04:15
- 1.148
- 1998/01/03 14:00
- 1.109
- 2004/03/19 10:15
- 1.100
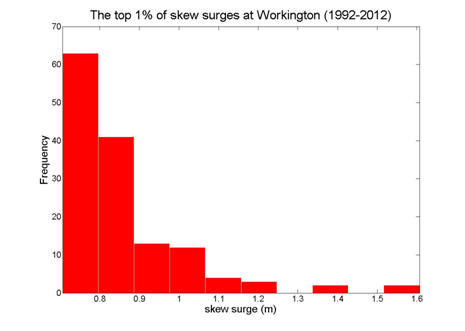
Workington
Data from 1992–2012 [data 95% complete]


Top 10 skew surges
- Date
- Surge (m)
- 1993/01/24 00:15
- 1.607
- 1997/12/24 19:45
- 1.570
- 1993/01/17 06:30
- 1.403
- 1996/11/06 08:00
- 1.365
- 1993/01/21 23:00
- 1.241
- 2008/01/31 05:15
- 1.210
- 1998/01/03 14:30
- 1.162
- 2007/01/11 03:45
- 1.140
- 1993/12/08 19:00
- 1.128
- 1997/02/19 22:00
- 1.105