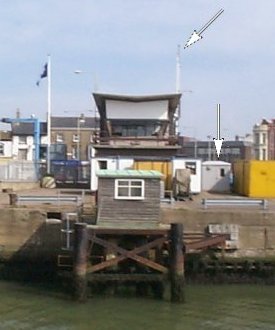
Lowestoft tide gauge site
The disused tide gauge building can be seen in the centre of the picture mounted above the two stilling wells. The present building
is situated to the right of the Harbour Master's Office with the pressure points located on the quay wall approx 20m to the right
of the old tide gauge building. Wind speed and direction instruments are mounted on the pole attached to the right hand side wall
of the Harbour Master's Office.
Click here
to see a map of the site in a separate window.
Tide gauge location
The tide gauge equipment housed in the Glasdon building consists of a pneumatic bubbler system with two full tide and mid-tide pressure points mounted on steelwork attached to the quay wall. All three pressure lines, wind speed and wind direction are monitored by the POL data logger. A pressure signal is also supplied to an Ott pneumatic gauge for use by the Harbour.
 The tide gauge is levelled to the tidal gauge bench mark support by Ordnance Survey auxiliary marks.
External users
Sea level pressures and/or elevations from this site are supplied to the following authority:
- ABP Lowestoft
Site history
1976 – Ott punched tape and Munro IH40 in operation
1985 – Ott gauge removed from service and a Wellhead unit installed
1985 – DATARING unit installed and connected to the Munro and Wellhead unit
1989 – Wellhead unit replaced with a new unit
1996 – Munro float gauge and Wellhead unit taken out of service. A new GRP tide gauge building was erected away from the quay edge. Pneumatic bubbler system with two full-tide and mid-tide pressure points were installed 30 m seaward of the original tide gauge site. An Ott pneumatic gauge installed; the pneumatic systems were connected to the DATARING system
1999 – Anemometer and wind vane installed
2000 – POL data logger installed connected to the two full tide measuring systems
2002 – The mid-tide measuring system was connected to the POL data logger
| Location | |
| Latitude | 52° 28.374'N |
| Longitude | 1° 44.994'E |
| Grid ref | TM 5479 9274 |
| Earliest data | 1976 |
| Tidal levels | |
| HAT | 2.98 m |
| LAT | 0.12 m |
| MHWS | 2.58 m |
| MHWN | 2.24 m |
| MLWN | 1.16 m |
| MLWS | 0.64 m |
| H for 2024 | 2.98 m |
| L for 2024 | 0.12 m |
| H for 2025 | 2.91 m |
| L for 2025 | 0.21 m |
| MSR | 1.94 m |
| MNR | 1.08 m |
Abbreviations
HAT – highest astronomical tide
LAT – lowest astronomical tide
MHWS – mean high water springs
MHWN – mean high water neaps
MLWN – mean low water neaps
MLWS – mean low water springs
H – highest for year
L – lowest for year
MSR – mean spring range
MNR – mean neap range
Measurement devices
Tide gauge systemsFull-tide bubbler
Half-tide bubbler
Direct pressure transducer
Tide gauges
Ott pneumatic gauge
Munro float gauge
Wellhead float gauge
Lea float gauge
Instruments
DATARING logger
Datum probe